S-Parameter Viewer
A VNA-style Touchstone viewer for comparing parts. Overlay up to ten .sNp files, one-click return loss, insertion loss or isolation, snap-to-point markers, cross-grid trace math, and slide-ready export.
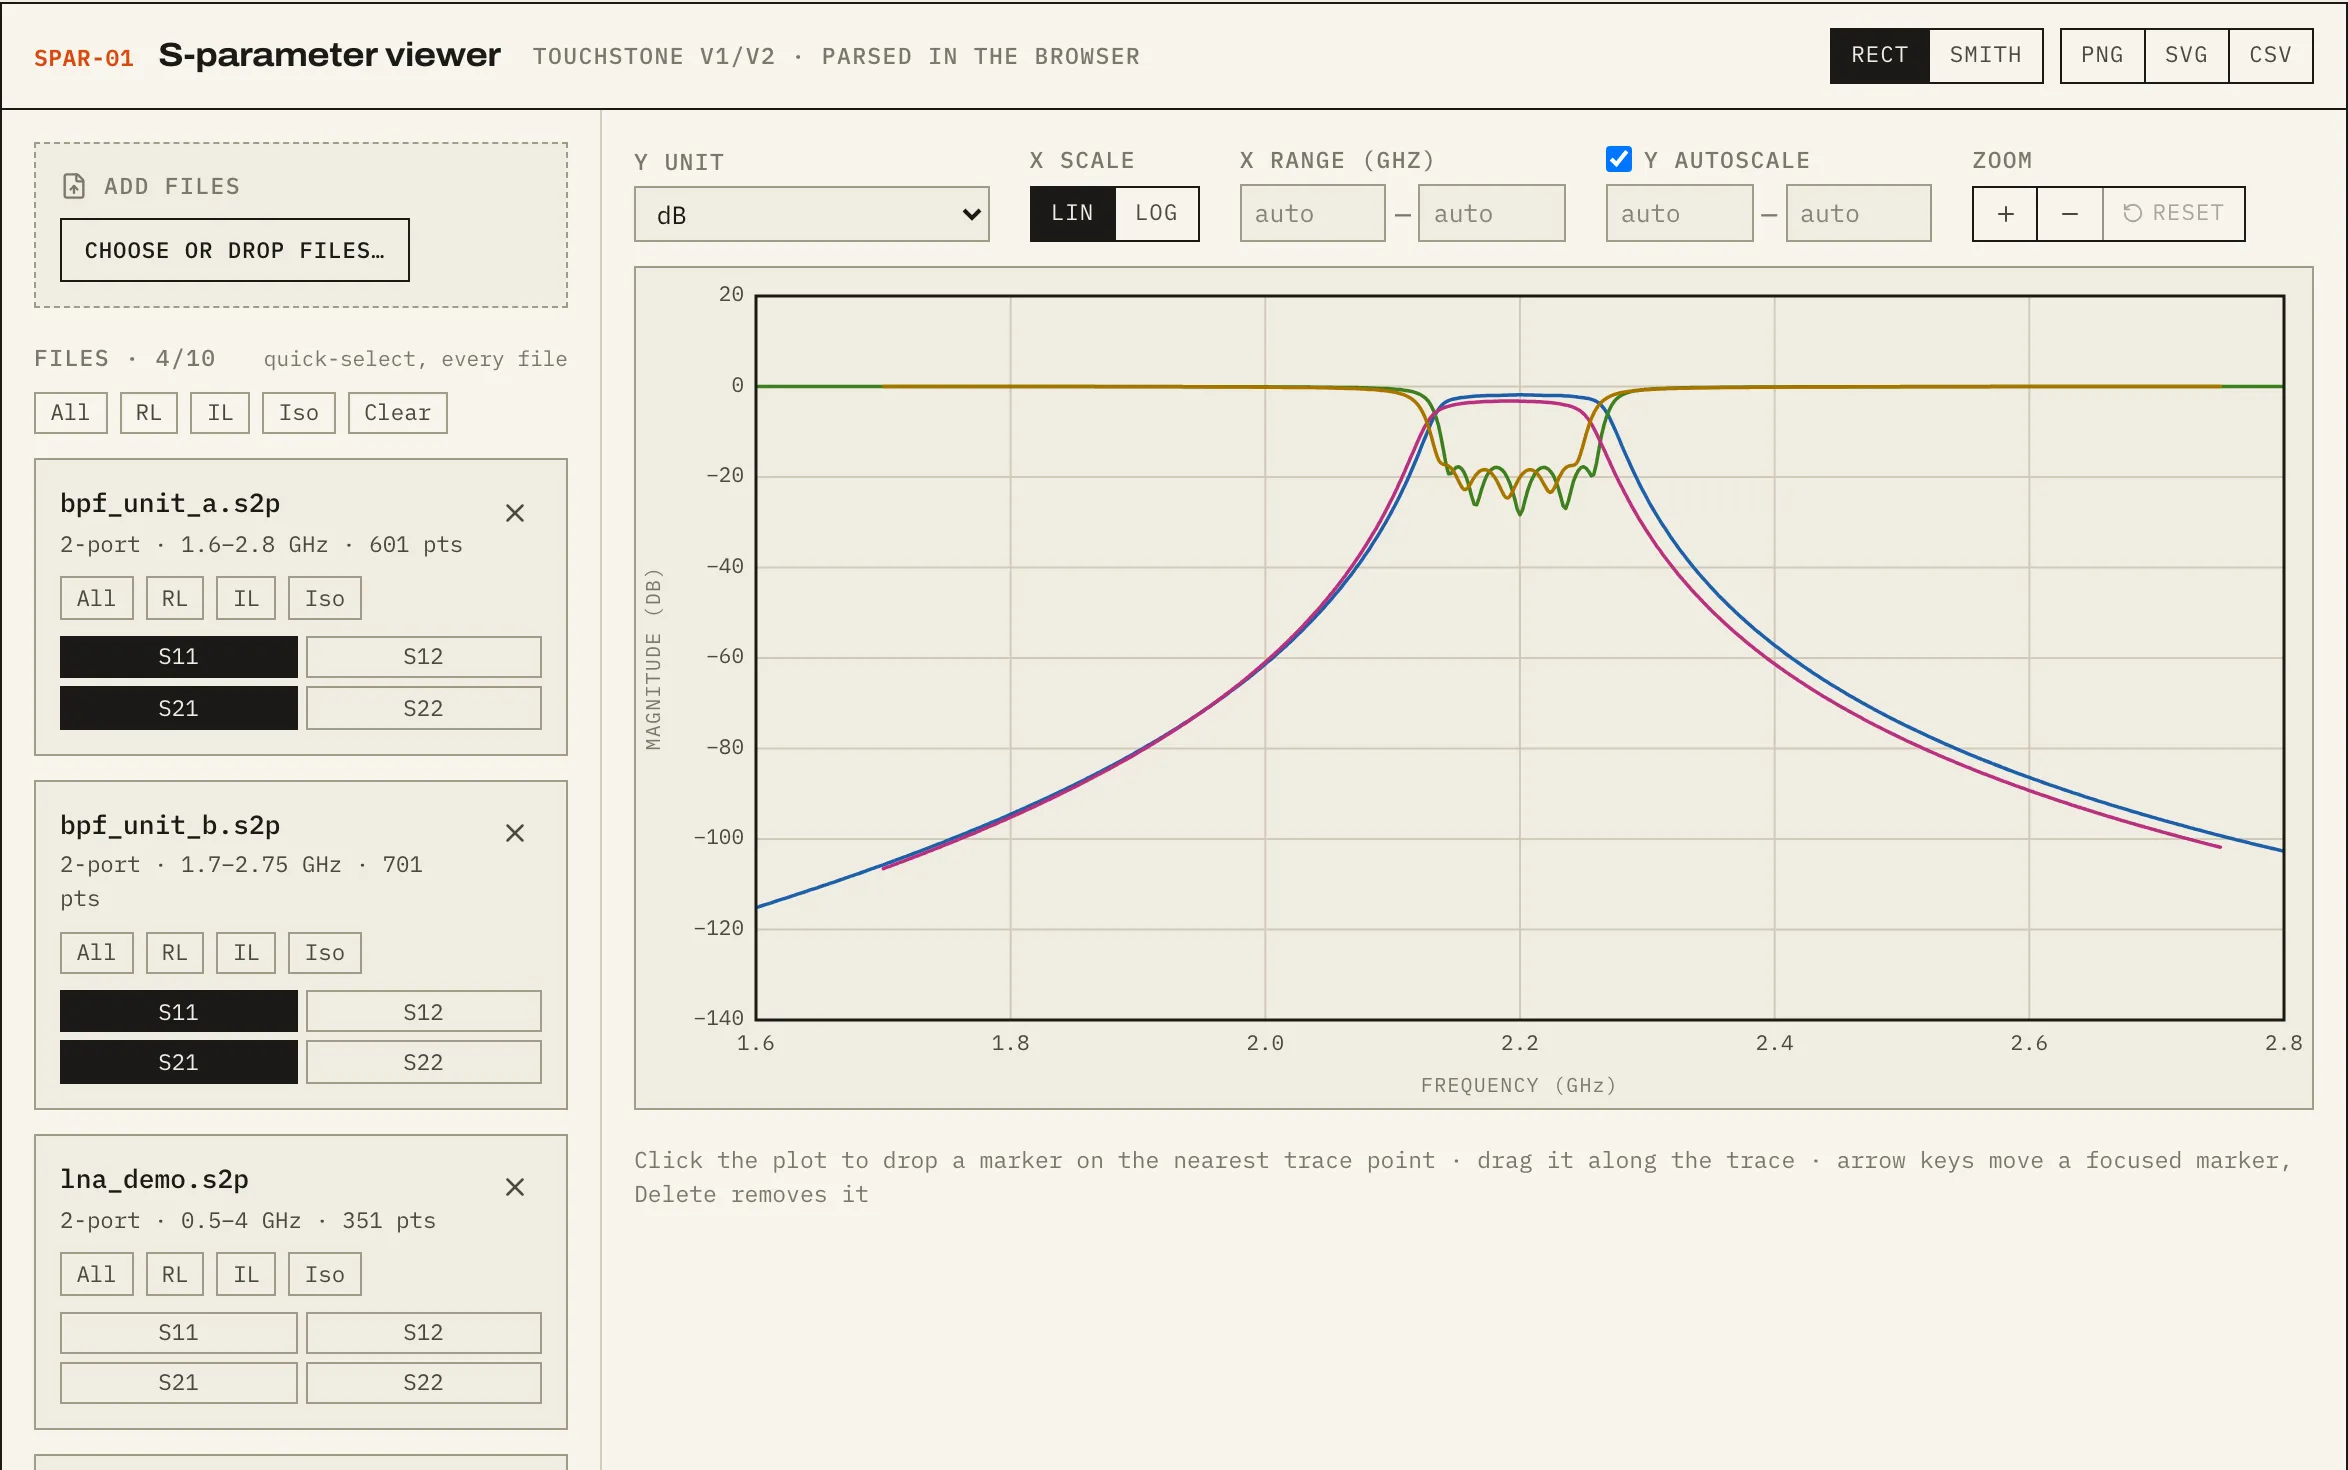
The usual workflow for comparing S-parameters is a one-off script per file and squinting at a matplotlib window. The two jobs that matter are overlaying one parameter across several parts, and producing a clean image for a slide with the marker table included. This does both.
What it does
- Multi-file overlay of up to ten files of any port count. Each file card shows port count, span and point count.
- One-click families: return loss is every Sxx, insertion loss every Sxy with x > y, isolation every Sxy with x < y. Defining them by index order means one click works on a 2-port or a 16-port.
- Markers that snap to data points, drag along the trace, and export with the plot.
- Trace math (A + B, A − B) between traces on different frequency grids.
- Export to PNG or SVG at slide resolution with the marker table drawn in, or long-format CSV.
The detail that matters
Cross-grid math is where naive tools go wrong. The viewer takes the overlapping span, uses whichever trace’s native grid is denser inside it, and resamples magnitude and unwrapped phase separately before recombining. Interpolating raw real and imaginary parts across a phase rotation creates magnitude dips that aren’t in the data.
Sessions need no accounts: each browser tab carries its own session id, files live in memory on the server with a timeout sweep, and uploads survive a refresh. One lesson from deployment: crypto.randomUUID doesn’t exist on plain-HTTP pages, which is exactly how LAN tools get deployed.
Now in the browser
It has since been rebuilt to run entirely client-side on this site’s RF Workbench. That version adds a Smith chart, VSWR, unwrapped phase and group delay, and never uploads a file.