RF CAT: RF compliance & analysis tool
A web application that turns raw RF test data (S-parameters, power sweeps, noise figure) into pass/fail compliance reports against each unit's requirements. It cut data review from about 60 minutes to 1 and has saved roughly 1,500 engineering hours. Nine months of development, 59 versioned releases, in daily production use.
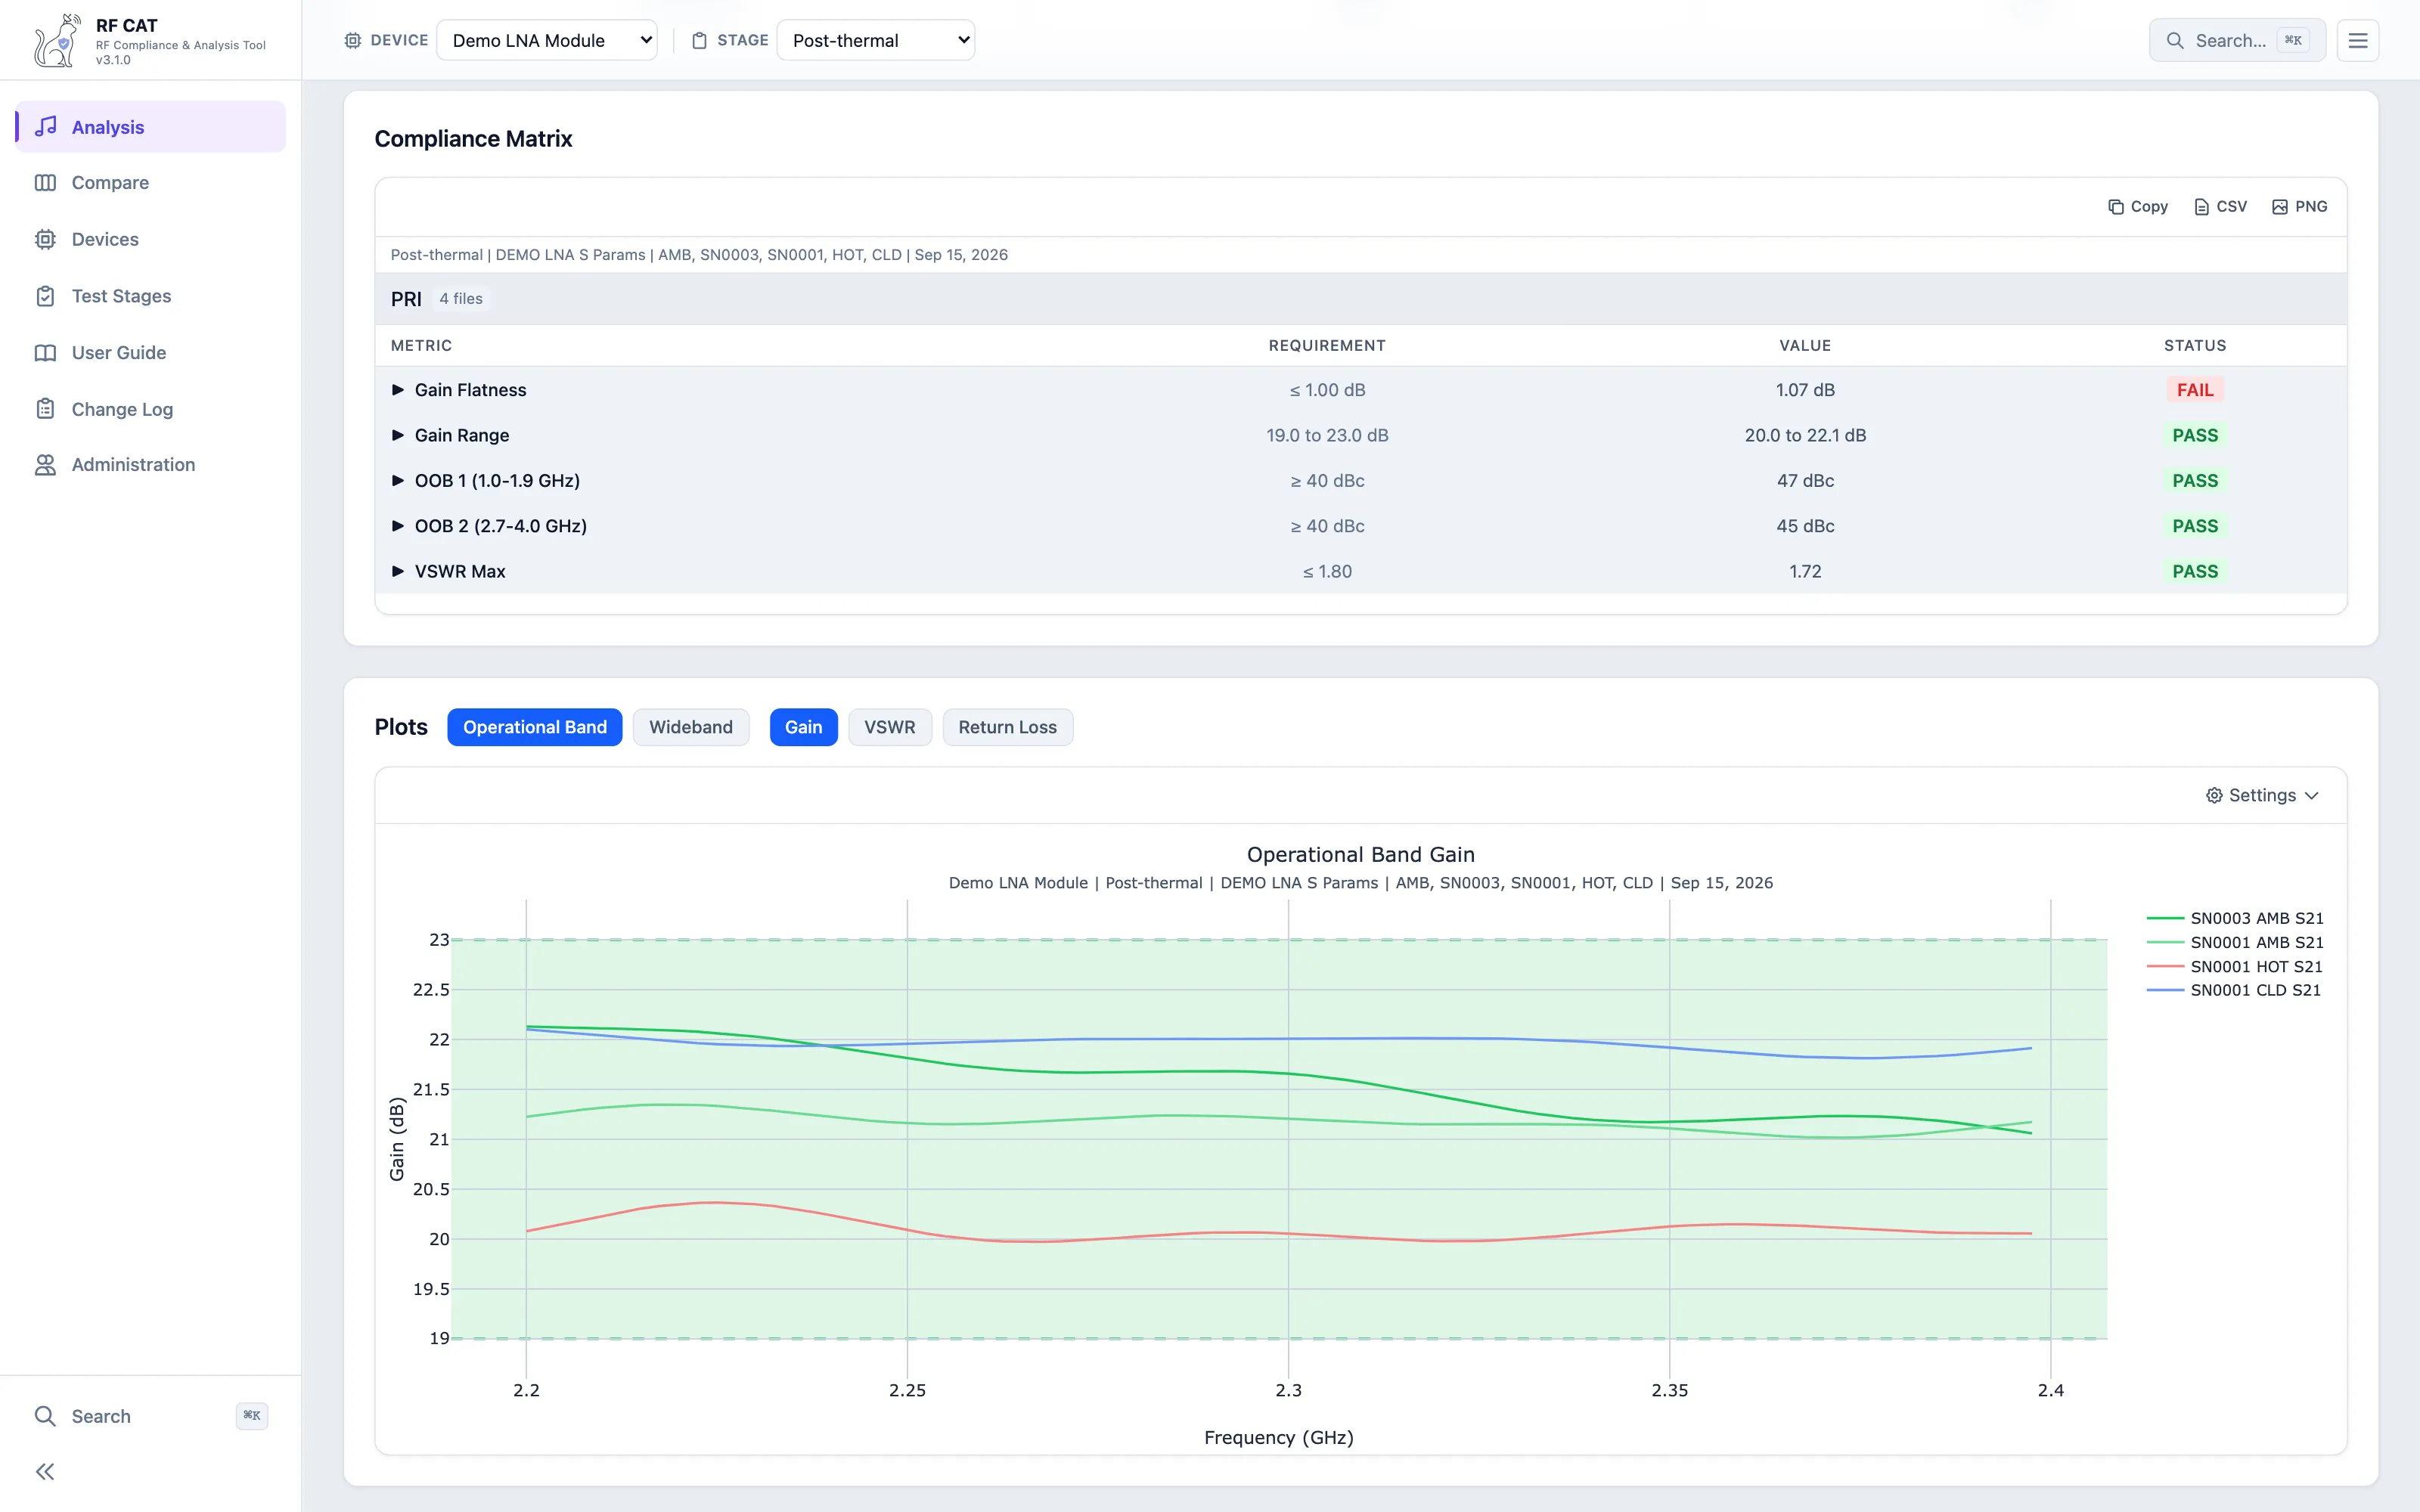
Built for an RF hardware test program I supported. Every unit comes off the bench with a stack of Touchstone files, power-sweep CSVs and noise-figure data, and every one has to be checked against its requirements at each test stage and temperature. Done by hand in spreadsheets and one-off scripts, a single review took about an hour. RF CAT does it in about a minute, with the same answer every time.
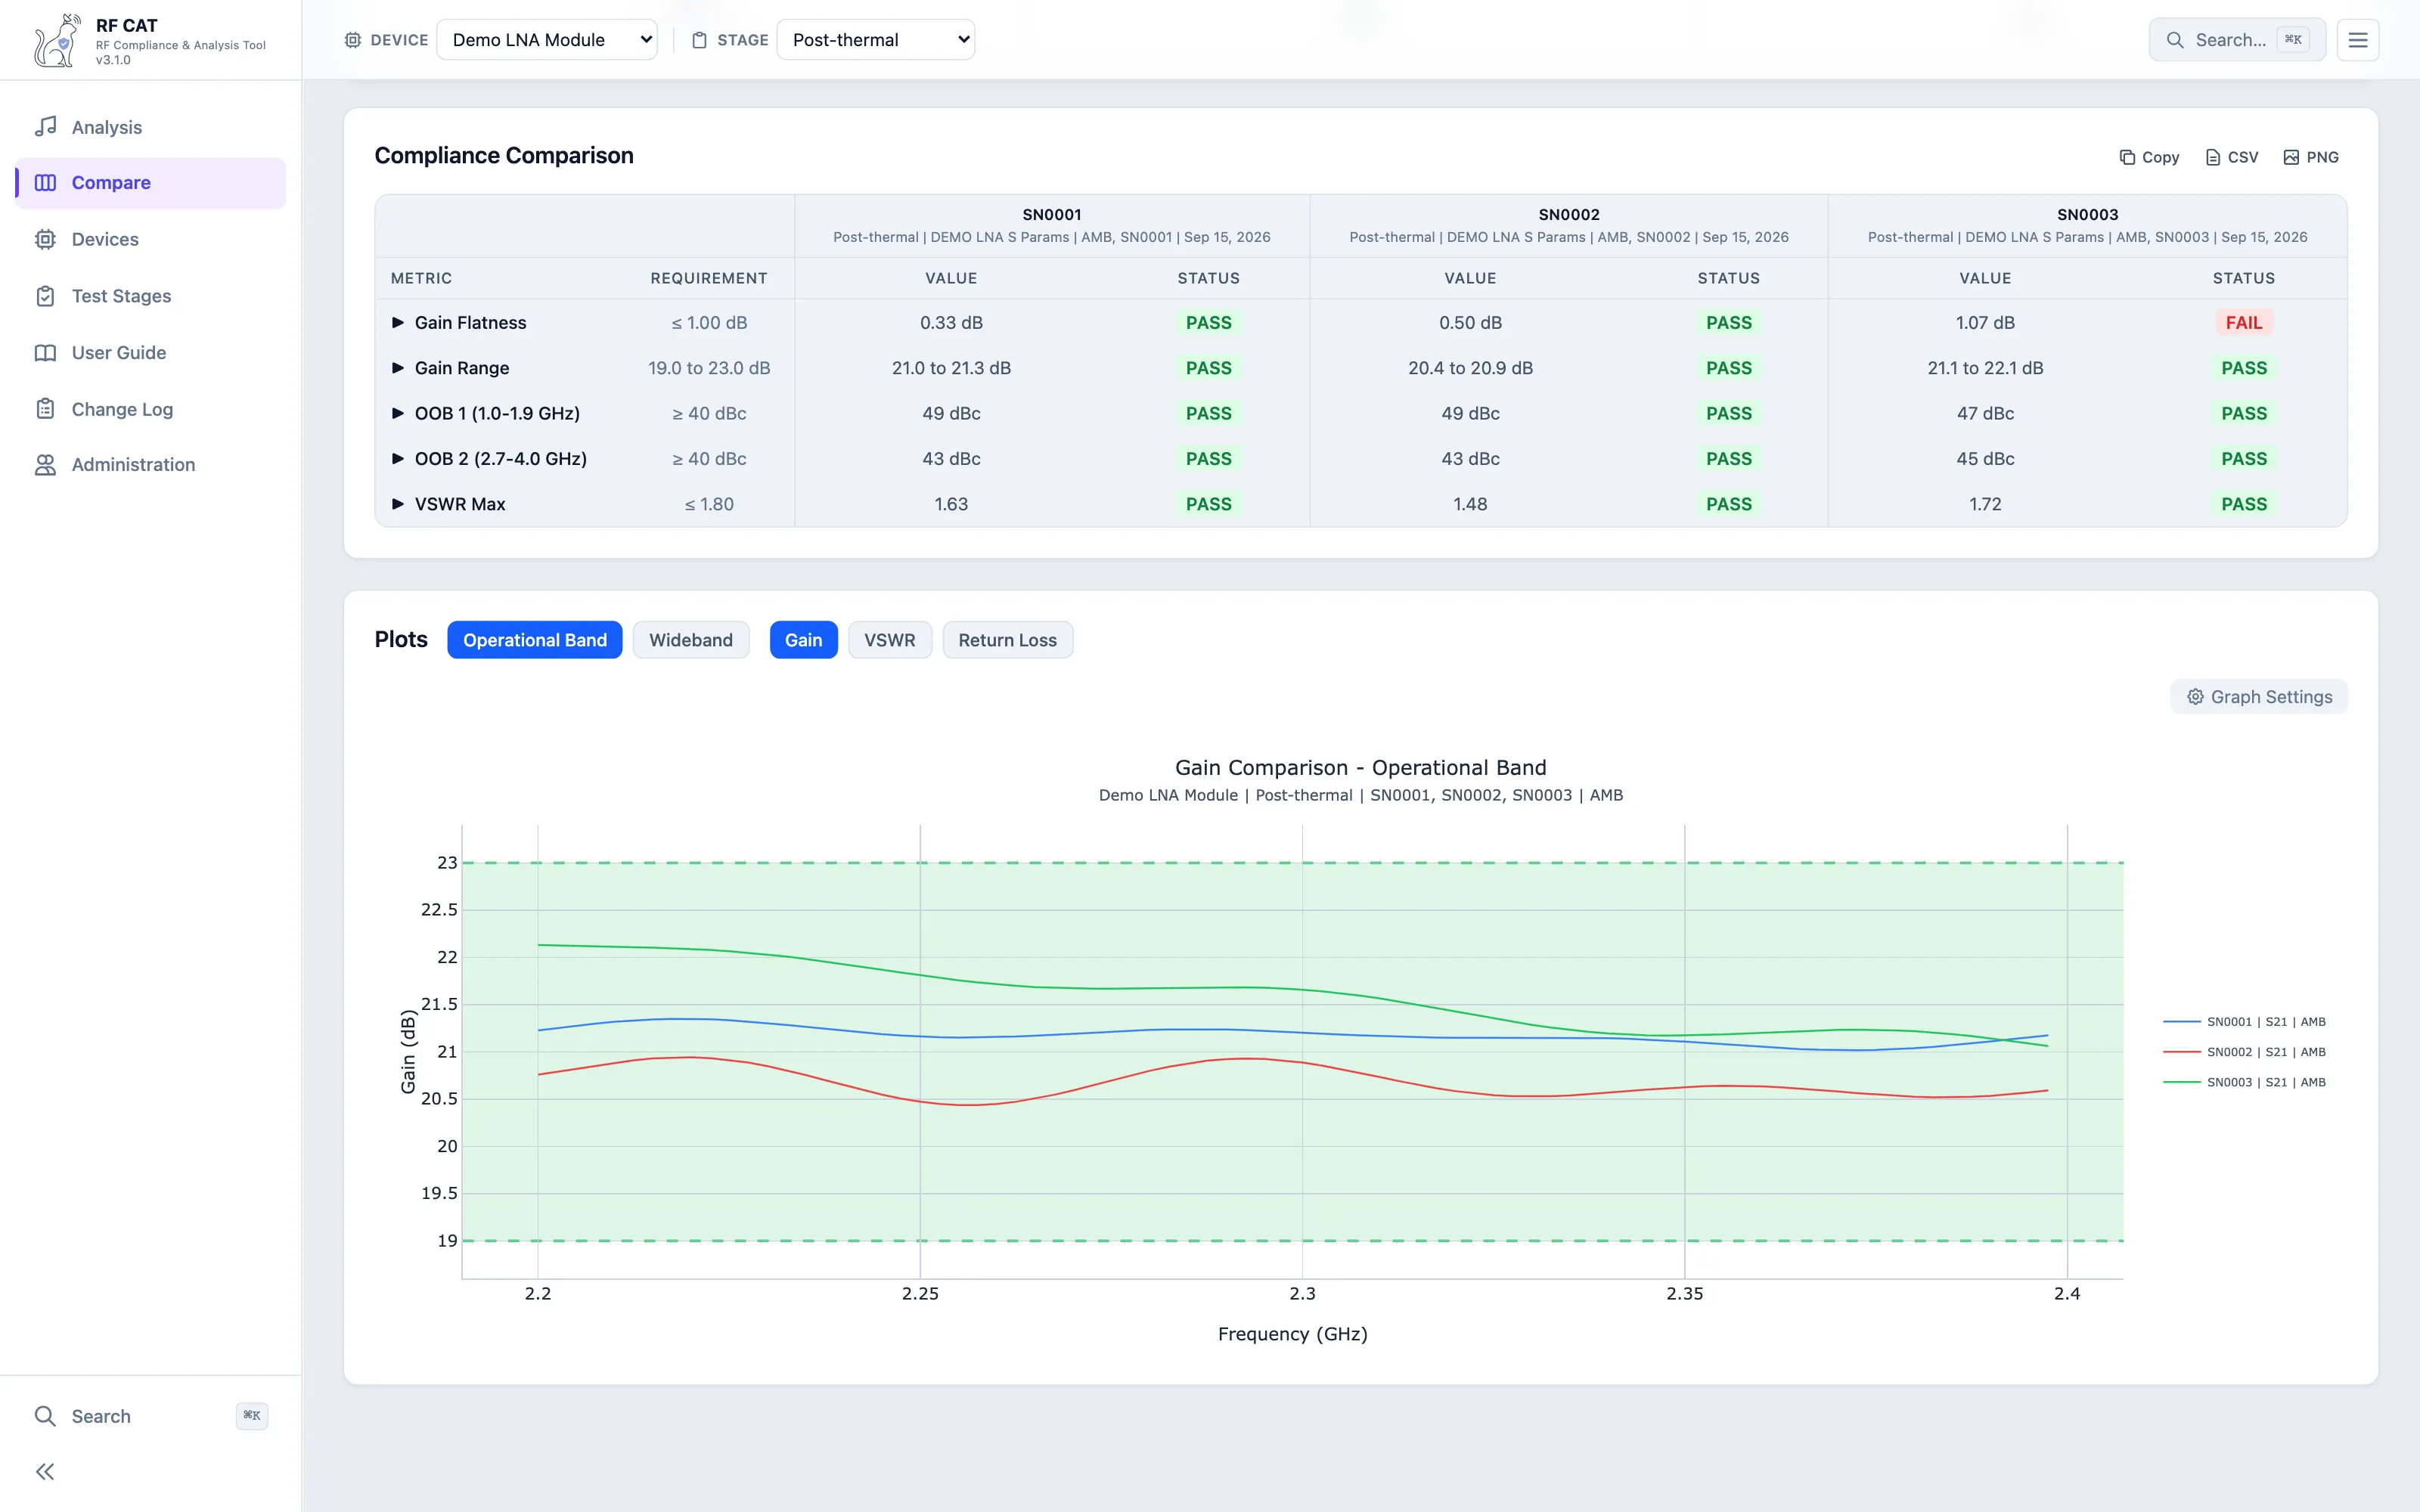
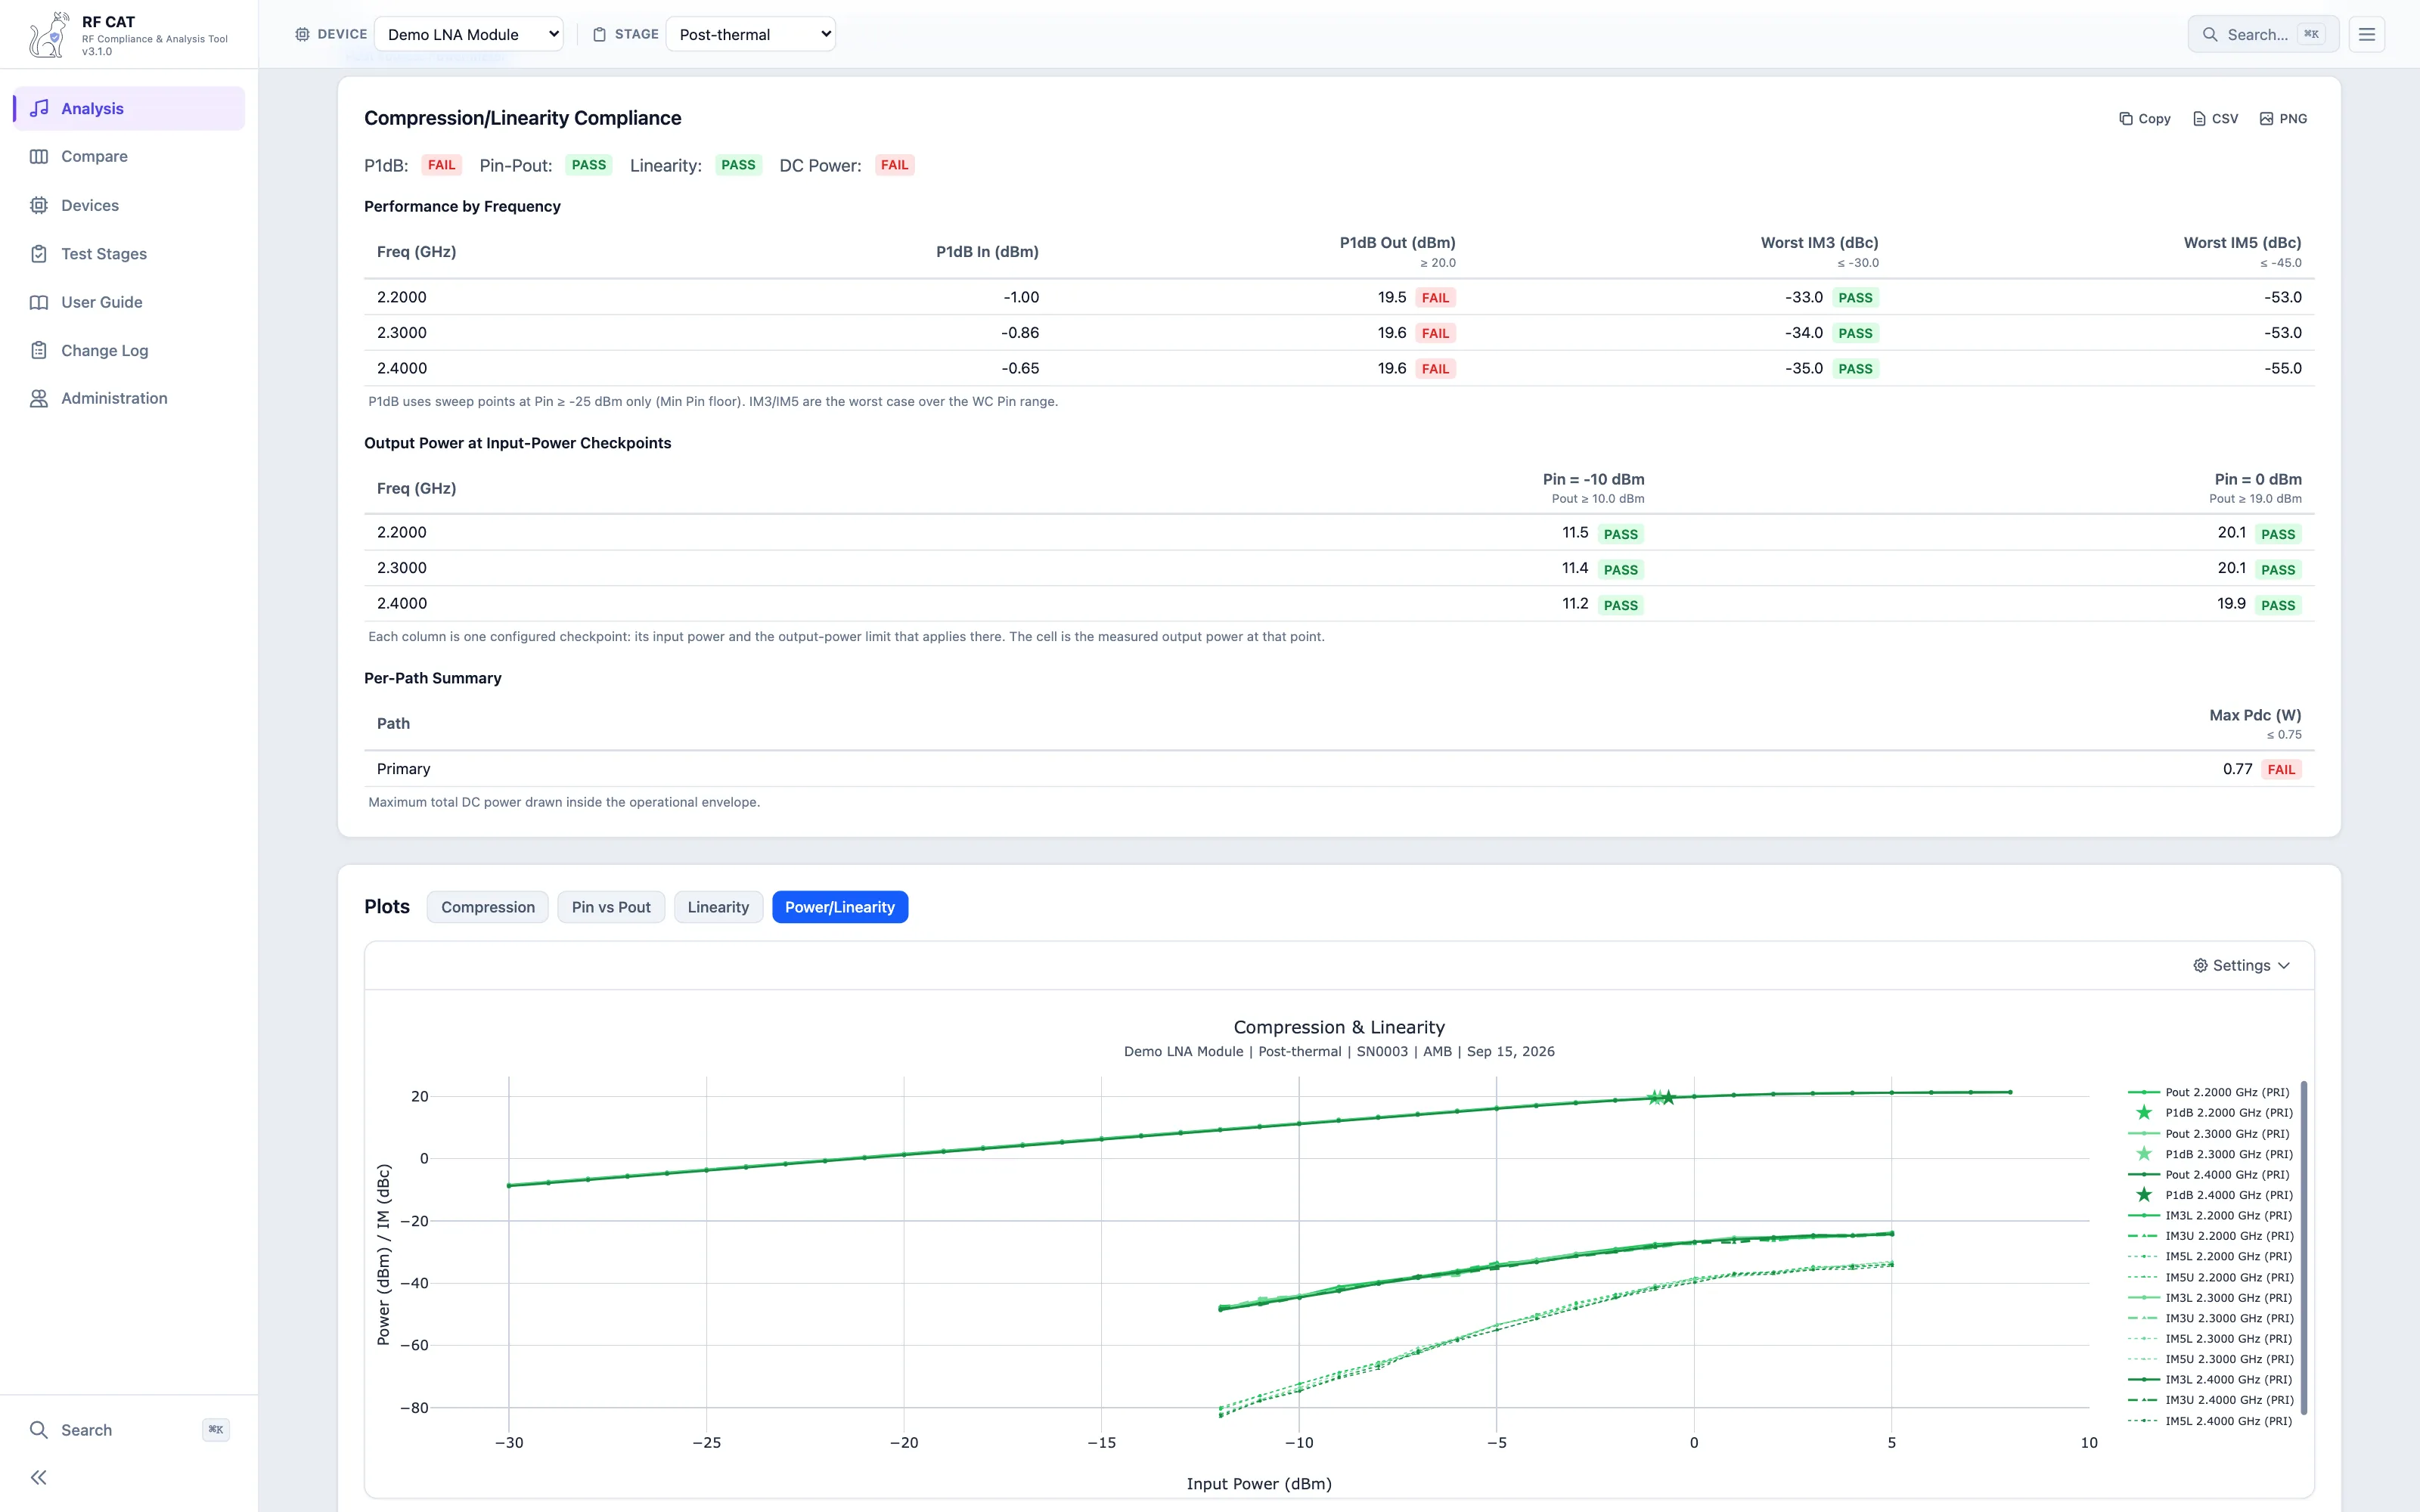
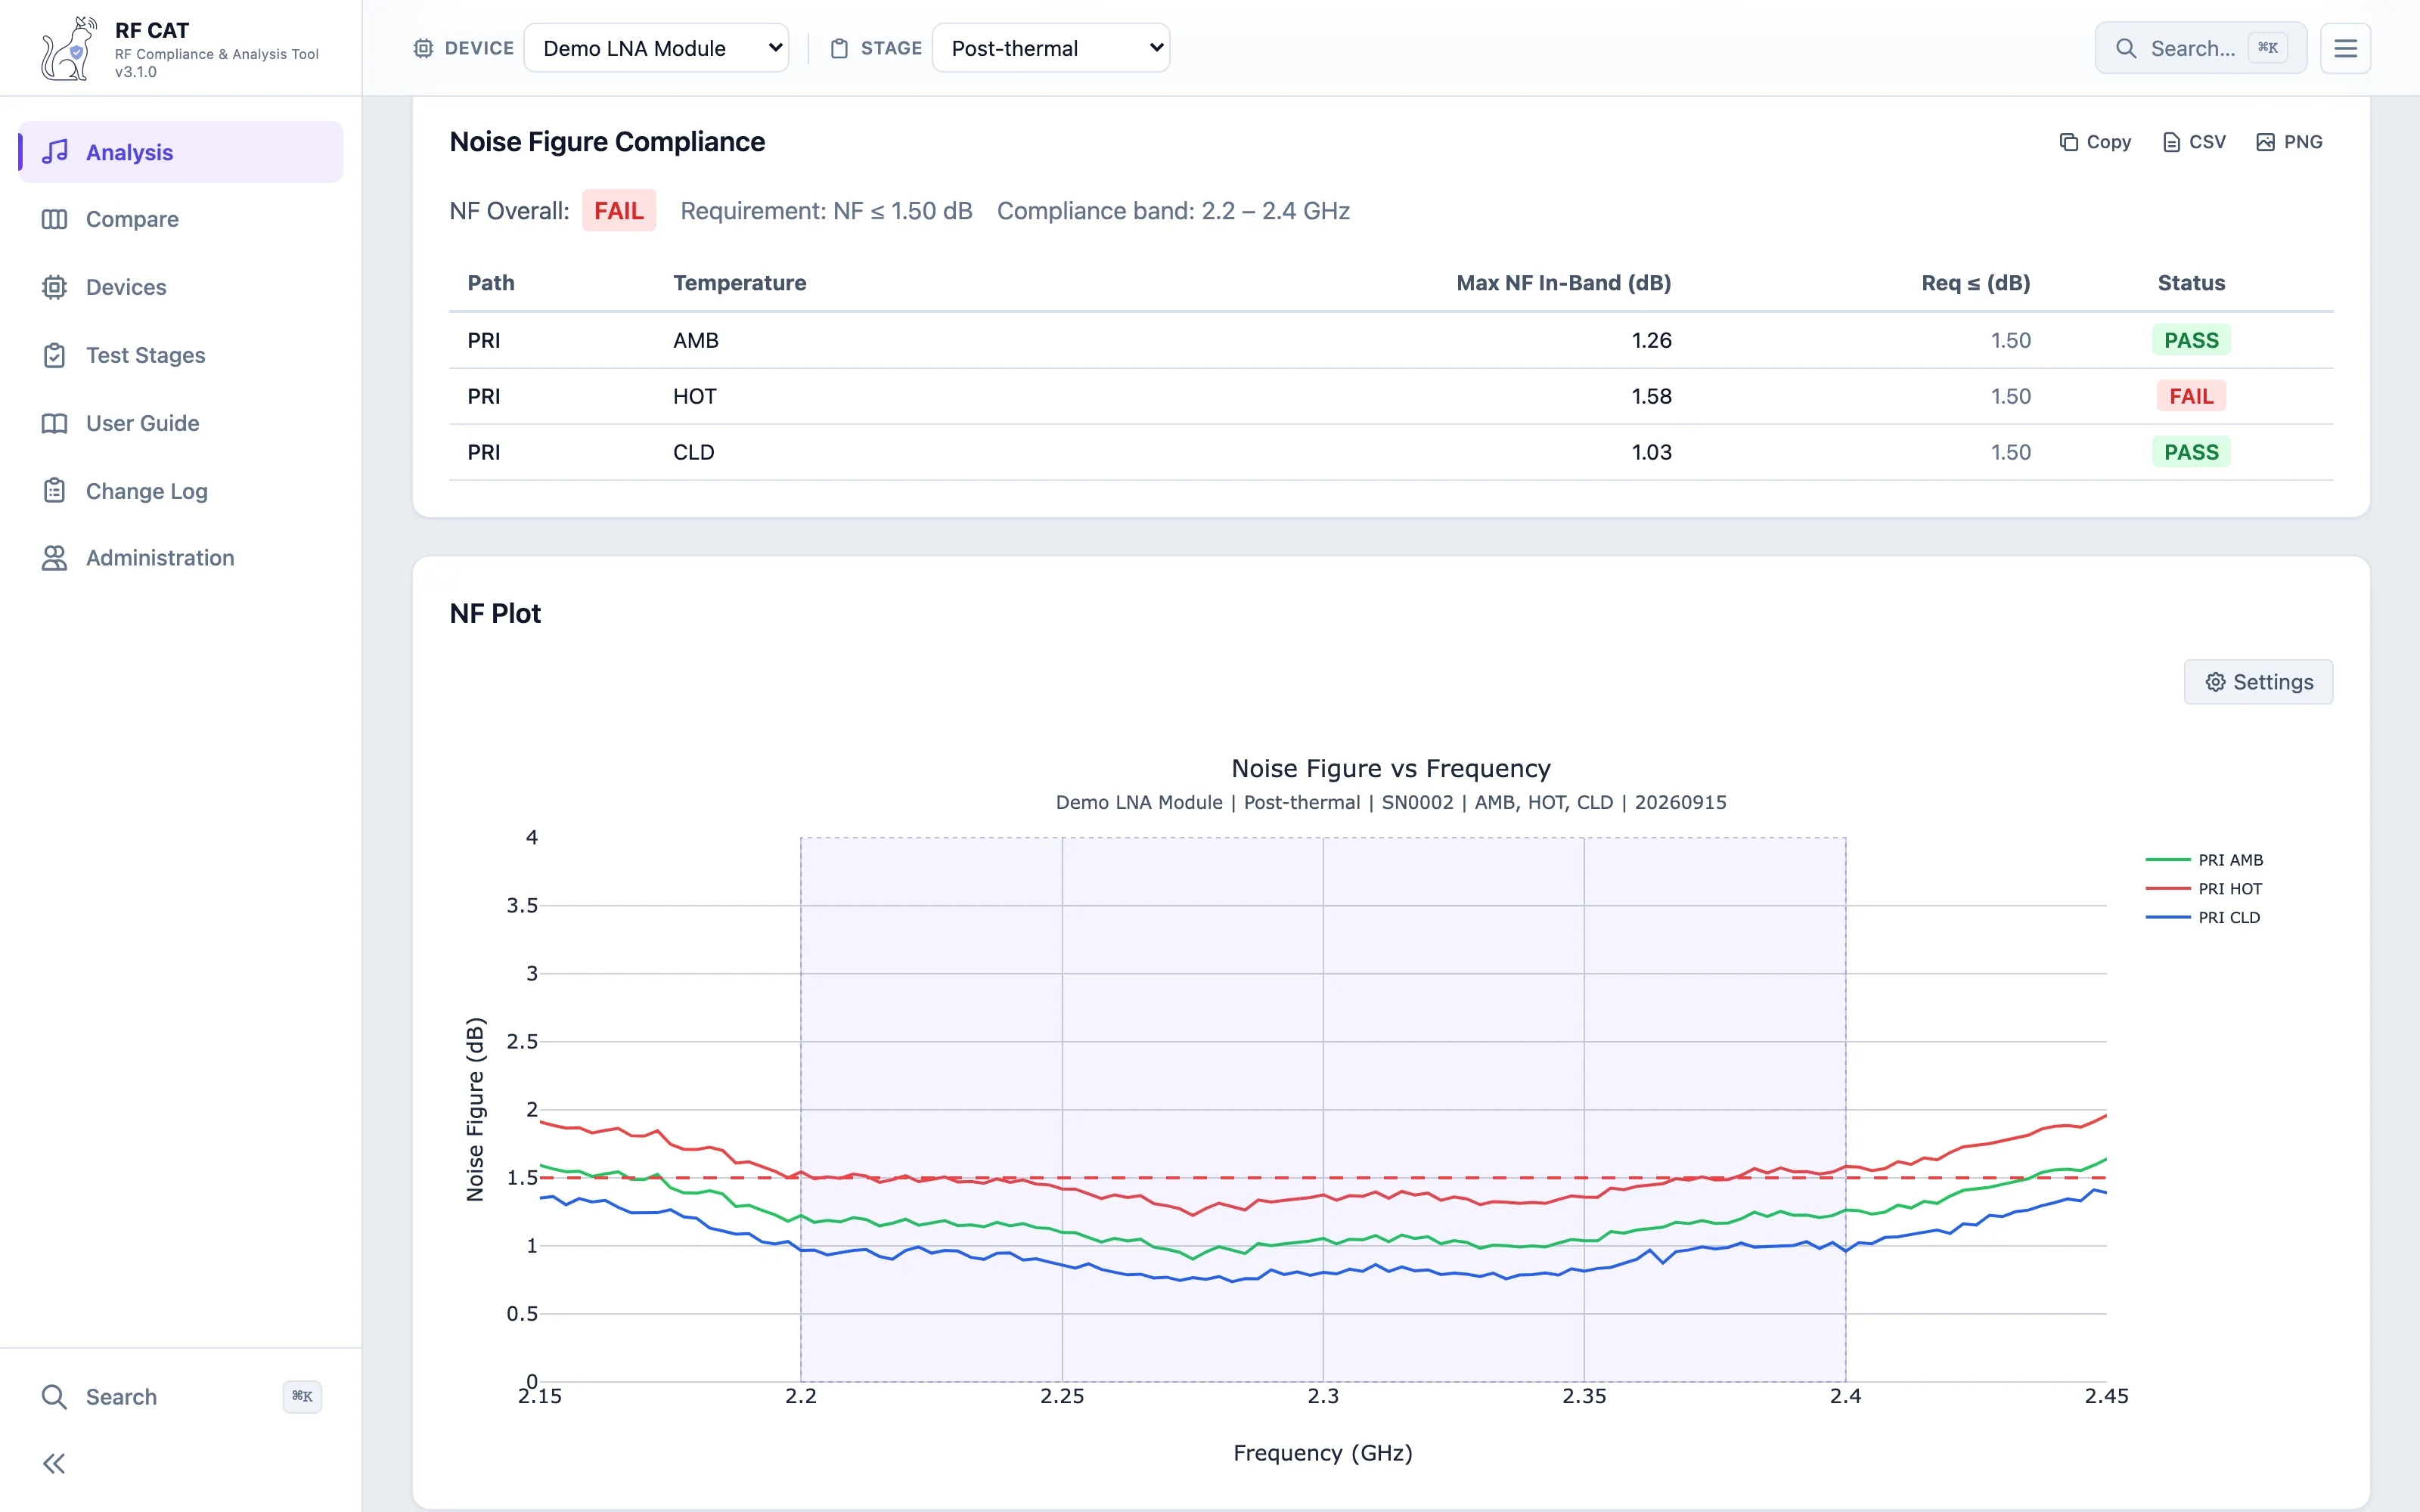
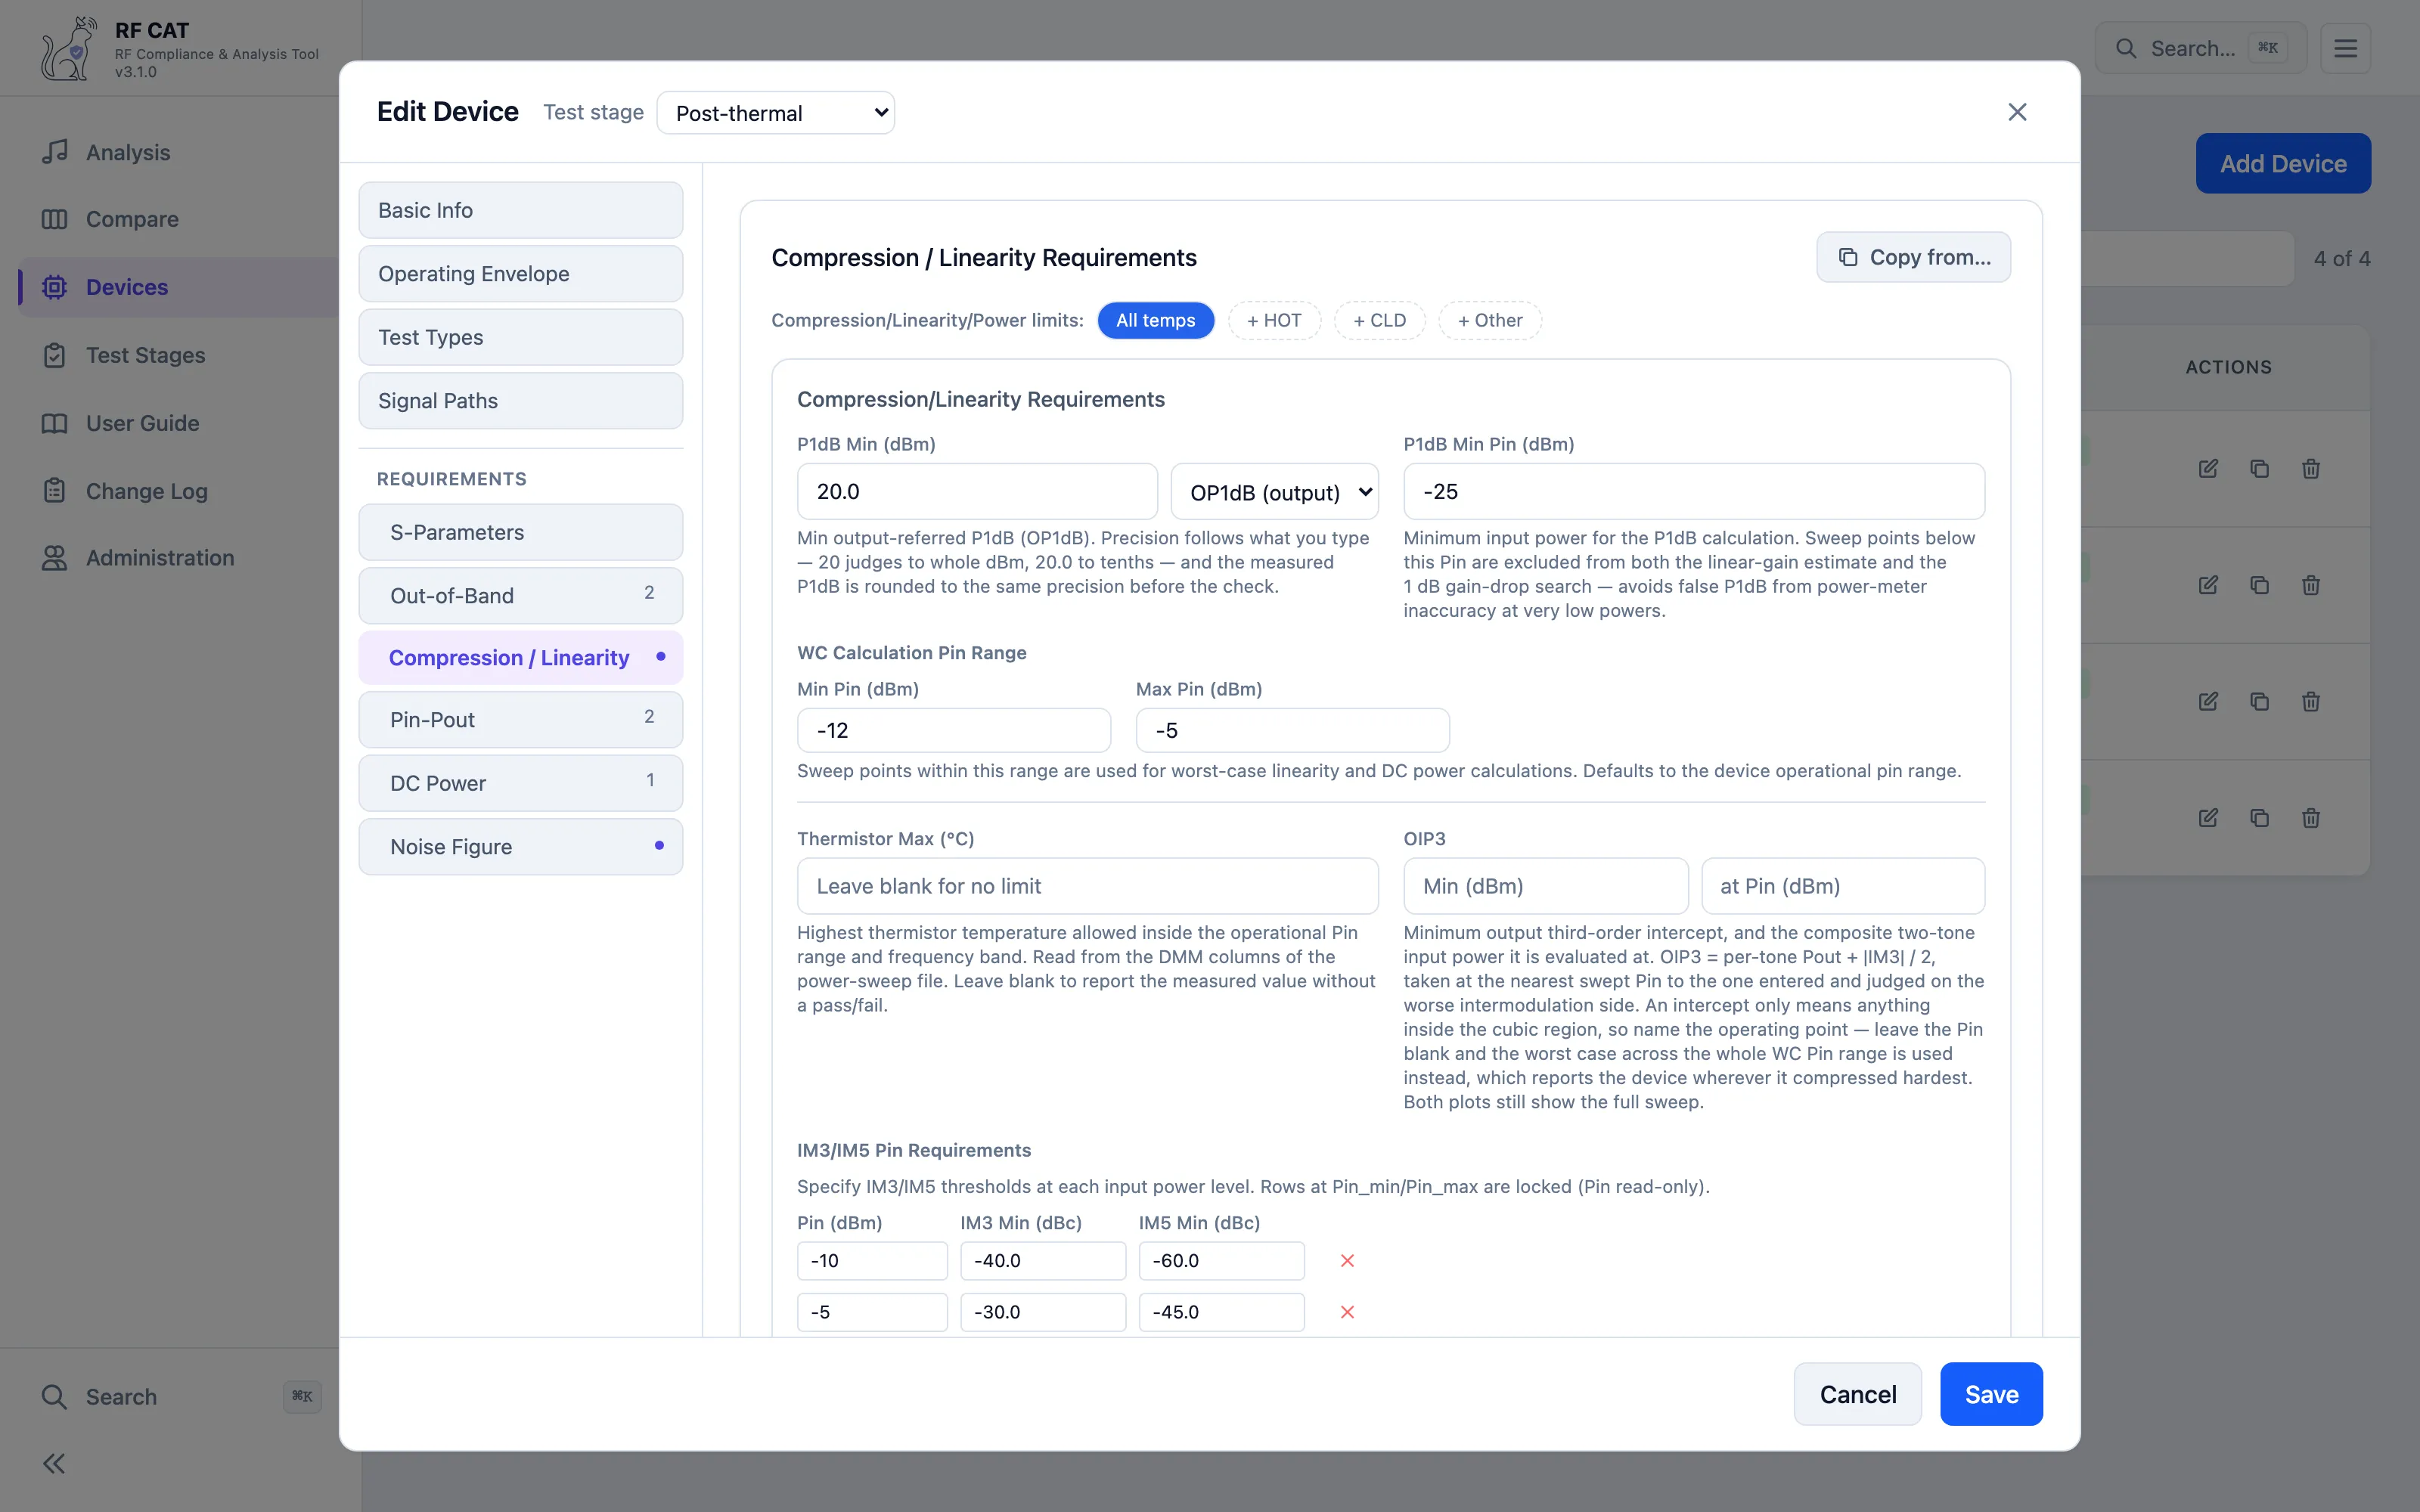
Screenshots use synthetic data and a made-up device. The tool’s real configurations, data and customer programs stay private.
What it does
- Device and test-stage requirements as data. Each device carries its operational band, sweep range, port mapping and gain modes, with separate requirements for every test stage. Configurations export and import as JSON so every workstation checks against the same limits.
- S-parameter compliance. Parses s1p through s4p files and pulls serial number, temperature, path, gain mode and test name from the filename. It checks in-band gain (with separate high- and low-gain limits), gain flatness (absolute, or a sliding-window slope), VSWR on input, output or both, and out-of-band rejection in dB or dBc relative to in-band gain. Switch-matrix units map multi-port measurements onto virtual S-parameters.
- Compression and linearity. Power-sweep CSVs give P1dB, Pin–Pout checkpoints, IM3, IM5 and DC power, with worst-case searches bounded to a configured input-power window.
- Noise figure against the in-band limit, with a per-file offset.
- Compare mode. Up to six units or temperatures side by side, in a columnar compliance table with overlaid plots.
- Reports that go straight into reviews. Auto-export saves the compliance tables and plots as images to a chosen folder after every analysis.
Details that mattered
- Rounding before comparison. Both the measured value and the limit are rounded to the requirement’s stated precision before pass/fail, so a 19.996 dB result against a 20.00 dB limit is judged the way a reviewer reads it, not failed on floating-point noise.
- Two-tone power is composite power. Two equal tones sum to +3.01 dB, so the worst-case IM3/IM5 search is bounded on total input power, matching how the bench defines the sweep.
- One tool, two deployments. The same code ships as a single-user Windows executable (PyInstaller, opens in the browser, no install) and as a hosted build for a team of 10–15 behind Waitress and Docker. Hosted mode adds accounts, programs, a password policy and an optional admin lock, while the desktop build behaves exactly as before.
- Safe concurrent use. Configuration writes are serialized and atomic, and every analysis gets its own temporary upload directory, so simultaneous users never see each other’s files.
Nine months, 59 releases
- December 2025: first commit on the 15th. S-parameter compliance, switch-matrix support and compression/linearity analysis within the first week.
- January 2026: compare mode and the Windows executable.
- April 2026: noise-figure analysis, and separate gain and VSWR test types.
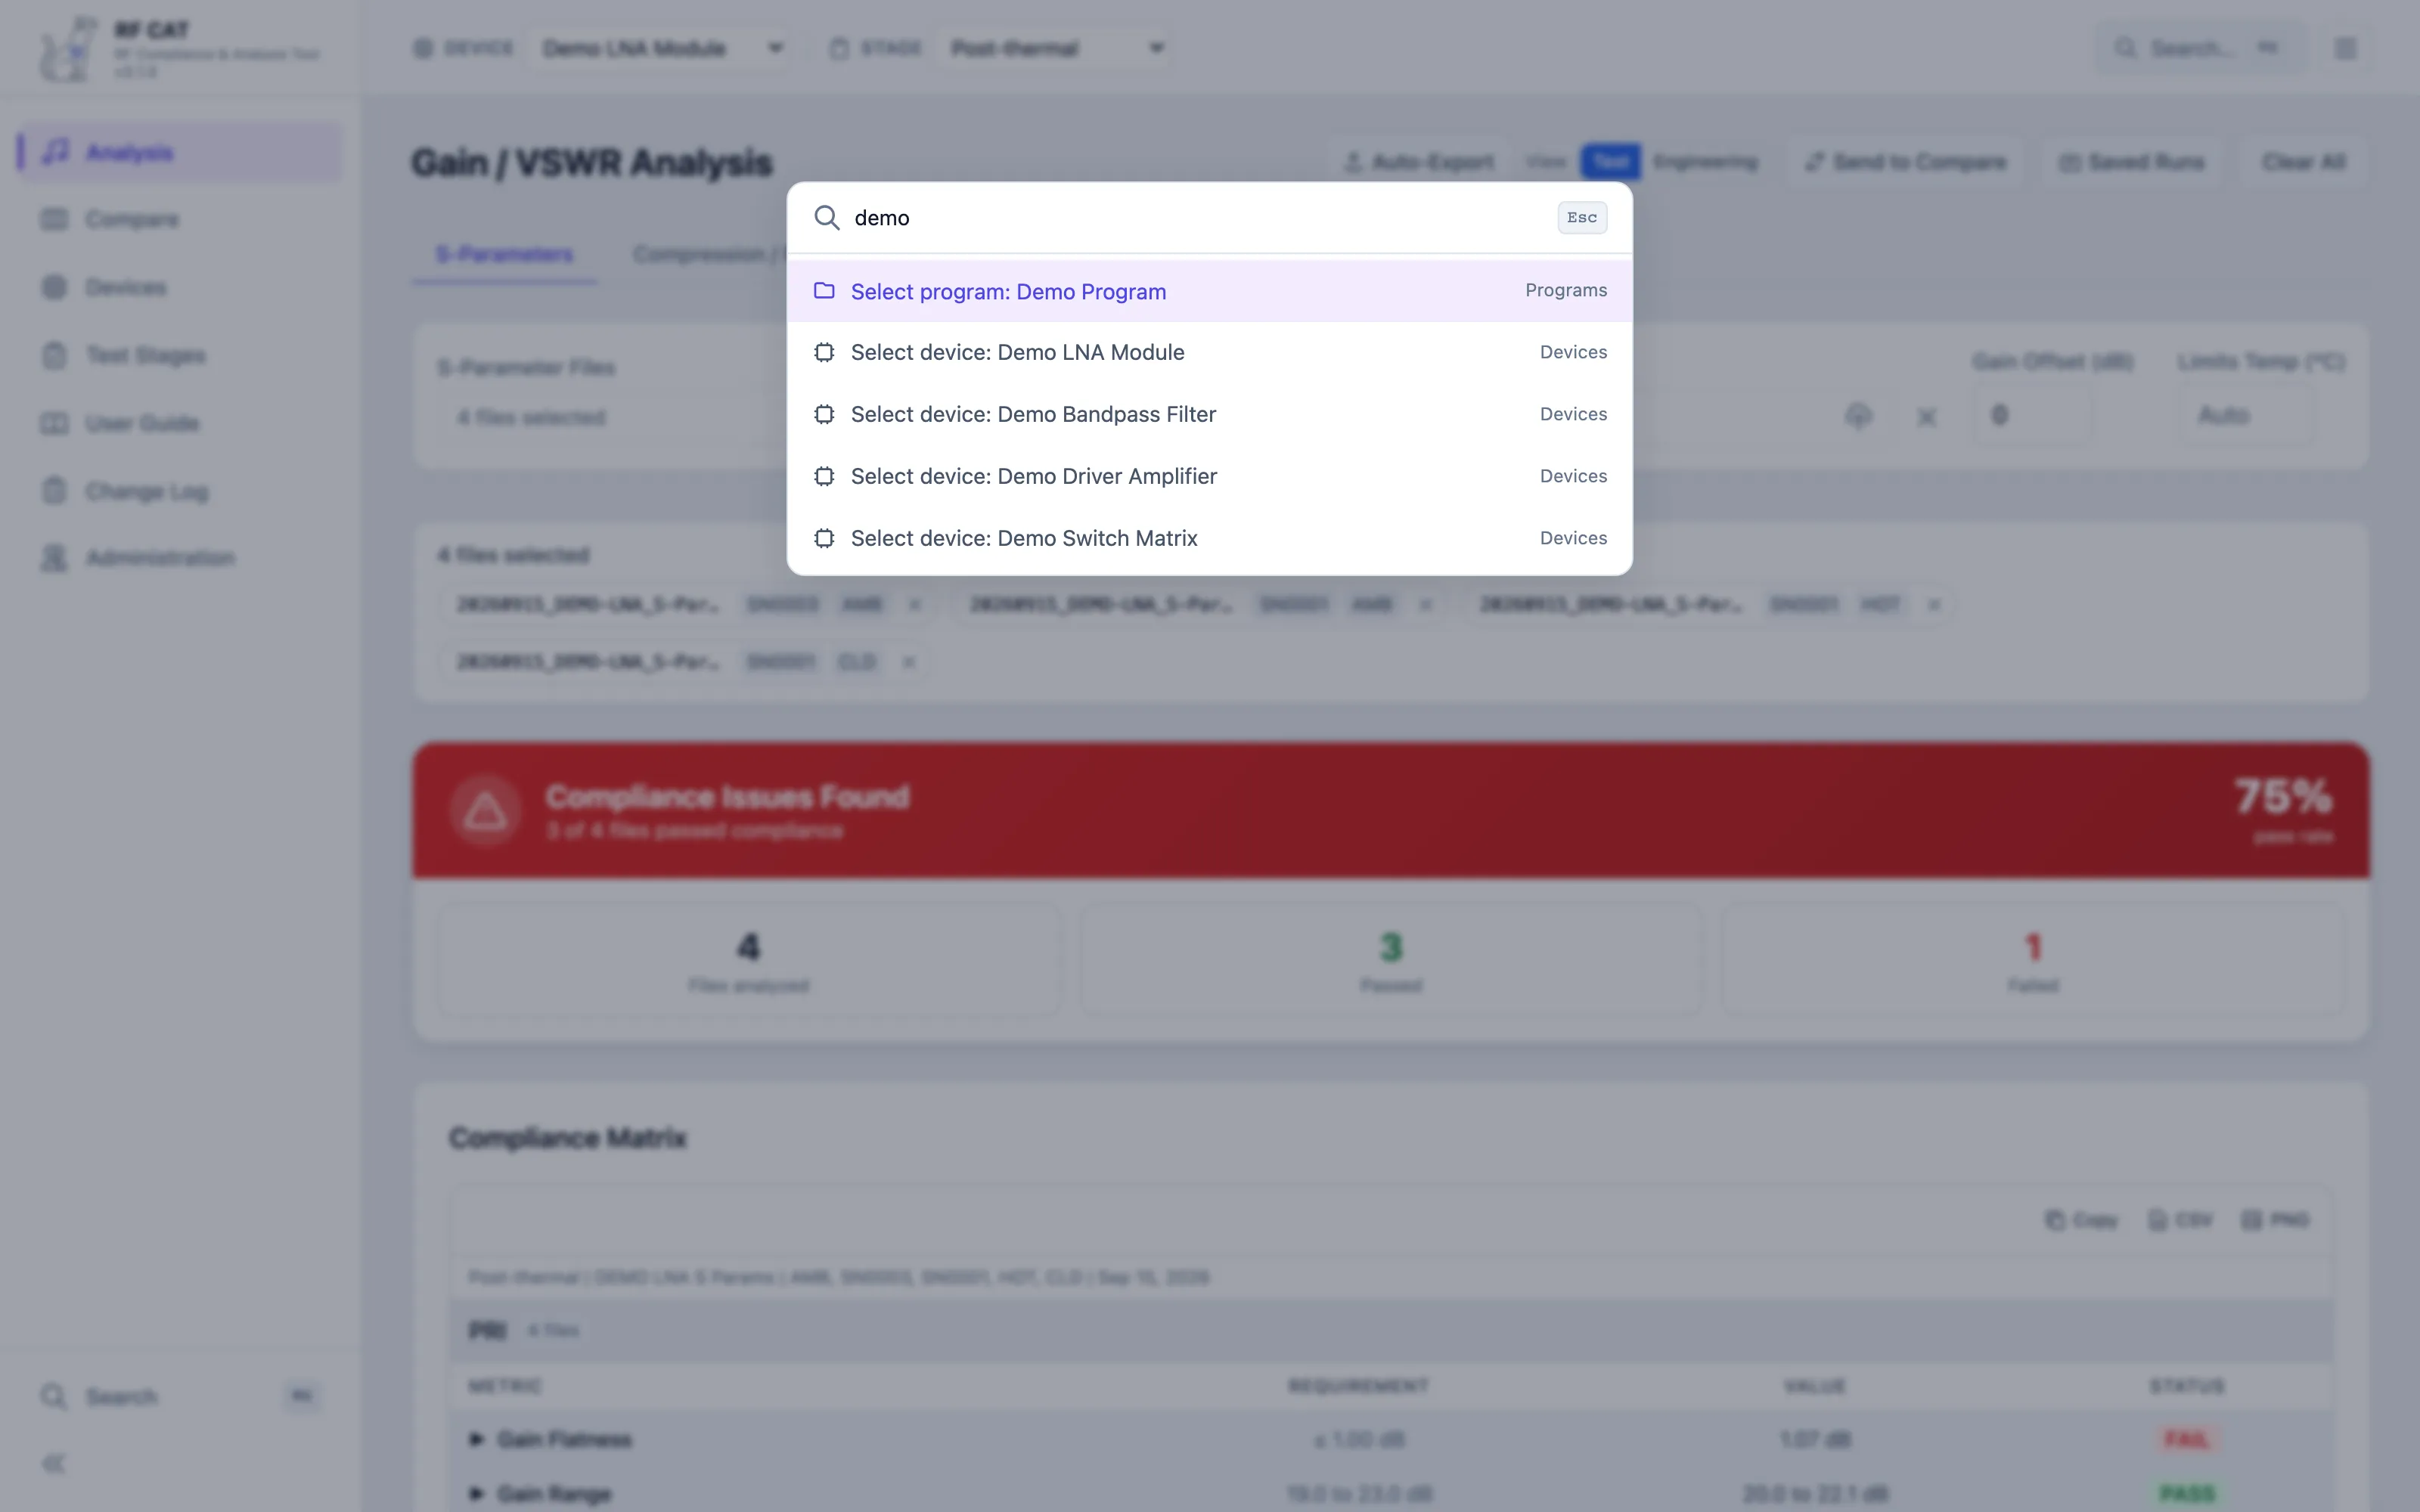
- June 2026: release 2.0, a modern UI overhaul (command palette, density toggle, collapsible sidebar), plus multi-user hosting with an admin gate and a Docker build.
- August 2026: release 3.0, built in Claude Code from a numbered spec: accounts and programs, a password policy, saved runs and session restore, remembered export folders, and a requirements coverage grid on the devices page.
Every release is recorded in an in-app changelog. The pattern is the one I use everywhere: write the feature as a spec, build it with an AI agent, check the numbers against real test data, and ship it with release notes. That’s how one RF engineer built and maintained a 41,000-line production tool alongside the hardware work.