The Homelab
A five-node Proxmox cluster with 100 CPU threads, 218 TB of ZFS, a segmented 10 GbE network and about twenty services, watched by Valhalla, a dashboard I built for it with Claude. It hosts every app on this site, and AI agents keep its runbook current and its media pipeline healthy.
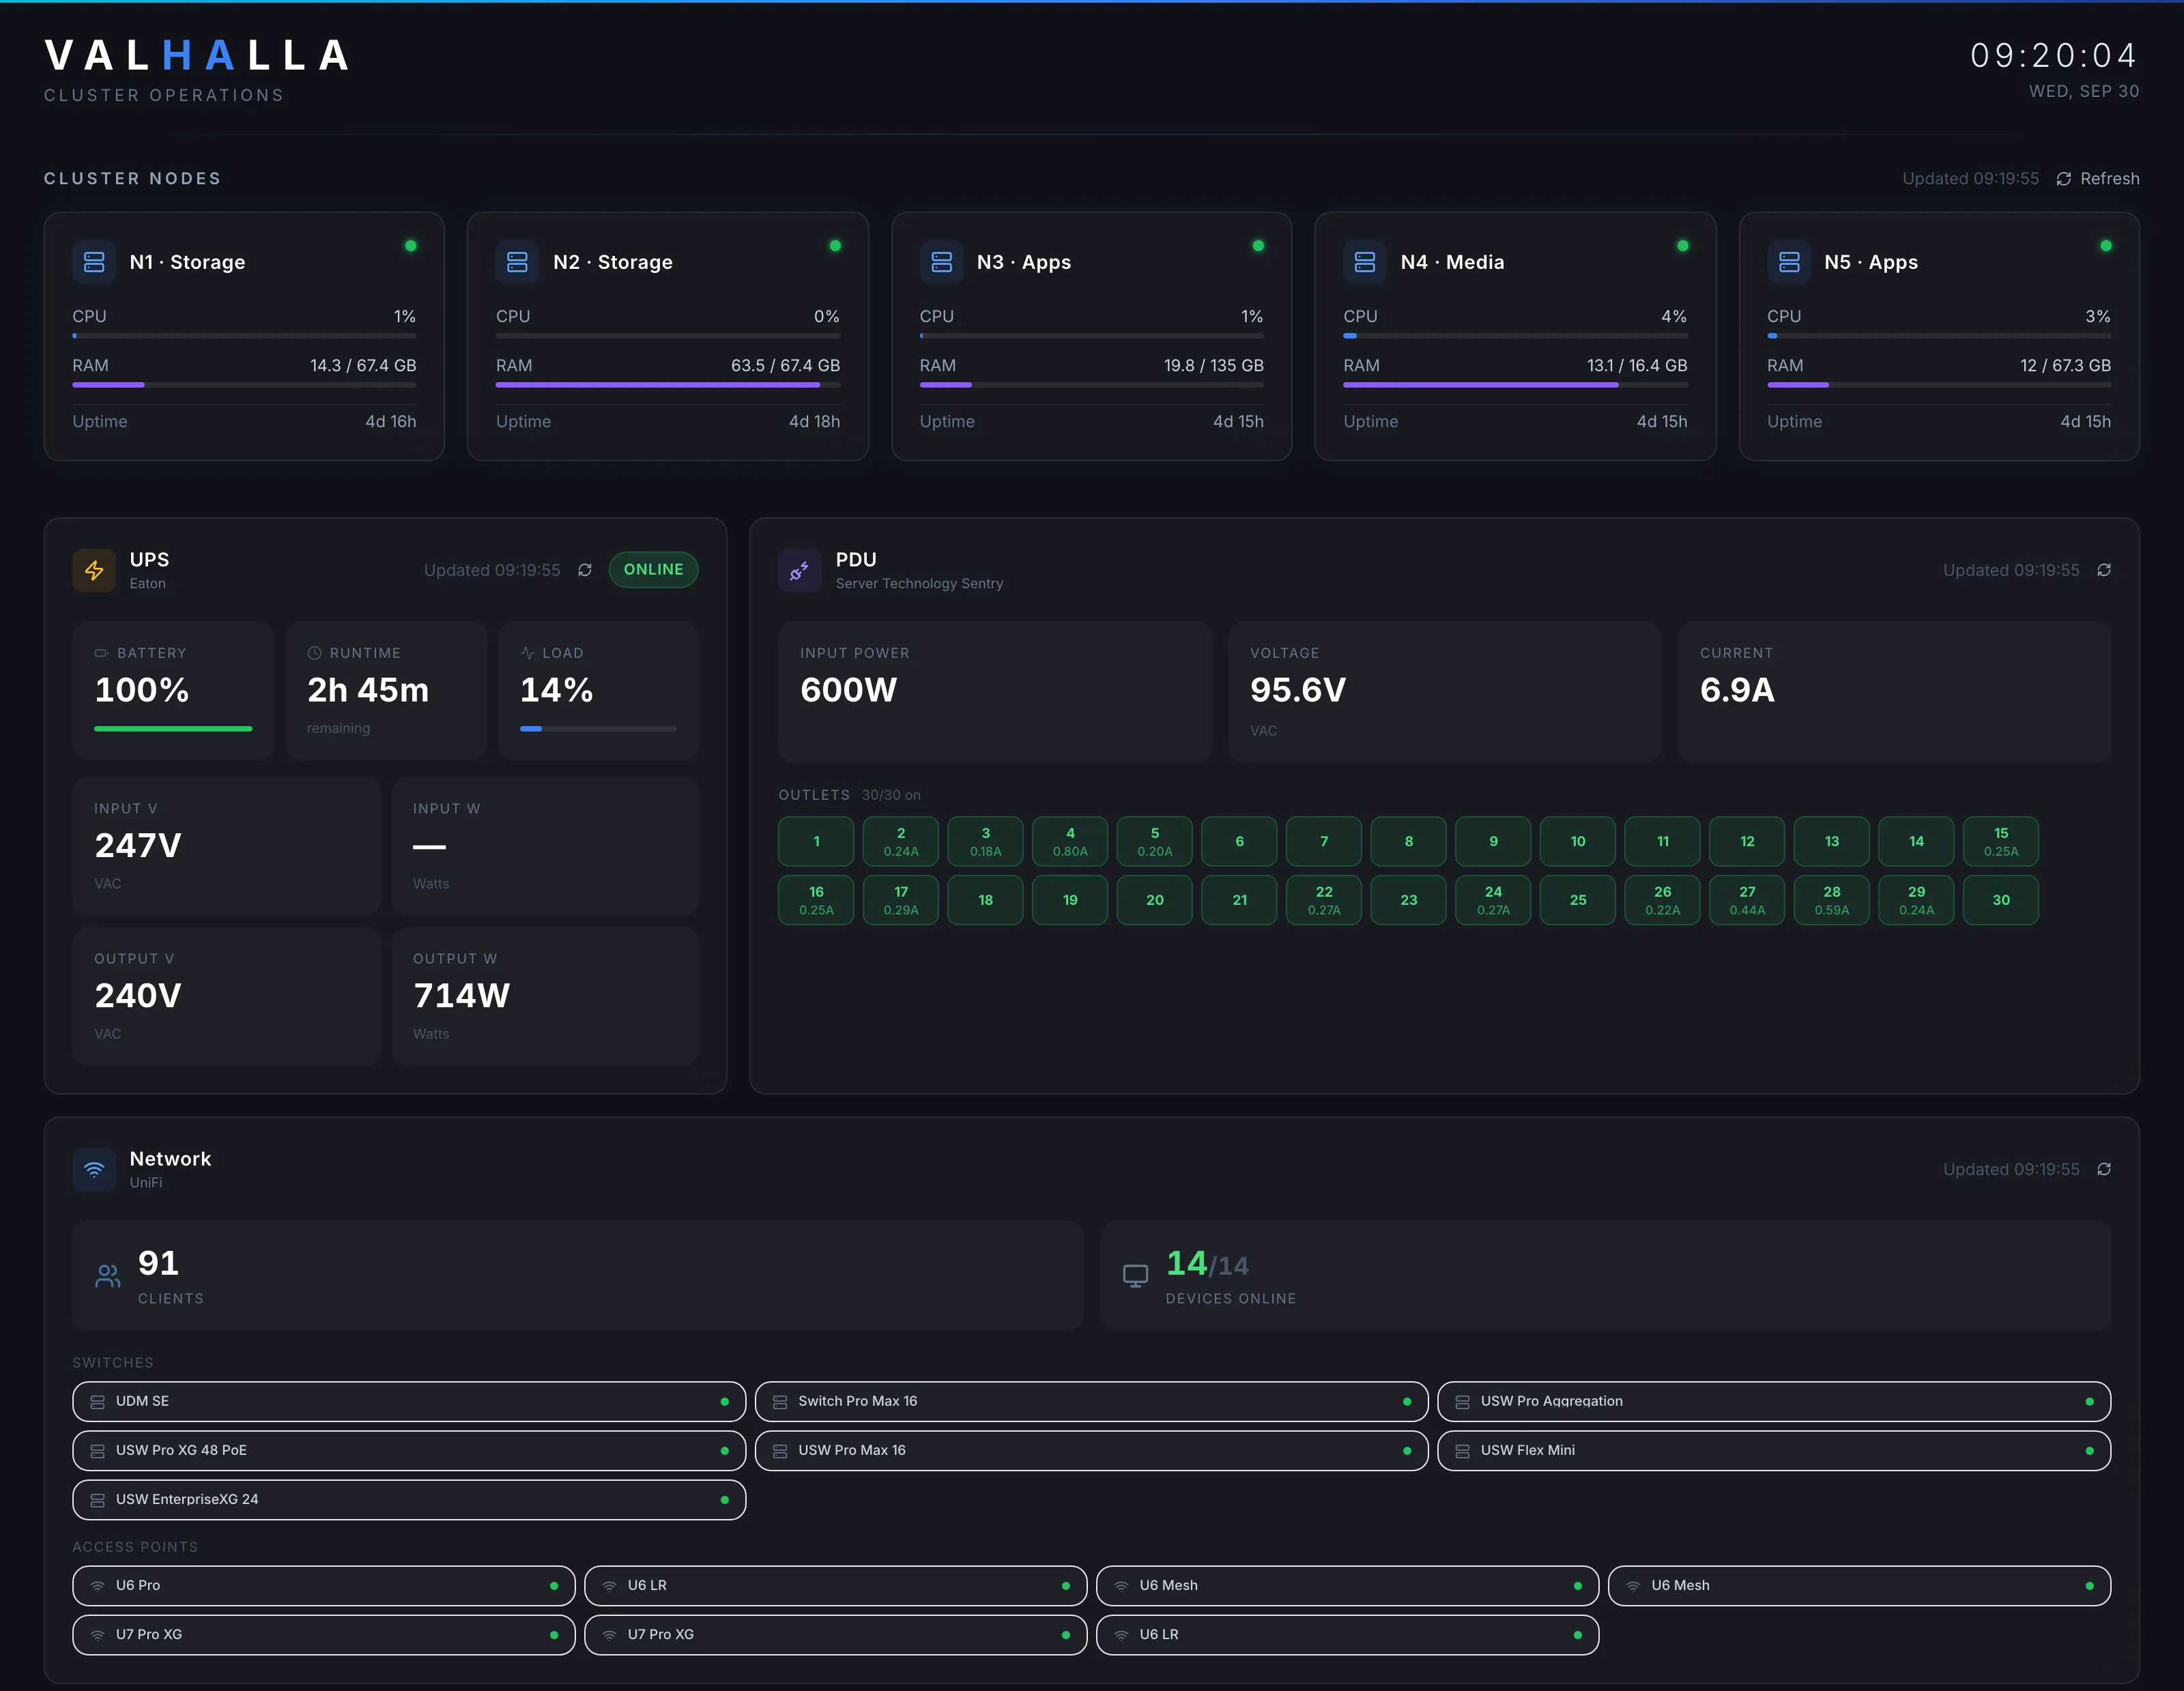
This is where everything else on this site runs: the store, the invoicing app, the wine cellar, the camera viewer and the lab tools. I run it the way I’d want a flight ground segment run: every node has one job, every change is written down, and one screen shows whether everything is healthy.
Architecture
- Compute: five Proxmox nodes with defined roles (Fig. 3). Two storage nodes, two application nodes and a media node whose GPUs are passed through for transcoding and camera object detection. Every VM is cloned from one Debian template, never built fresh.
- Storage: 12 × 24 TB SAS drives in RAIDZ2 for about 218 TB usable, grown from 10 to 12 drives in place with RAIDZ expansion. Mirrored SAS SSDs for hot data and mirrored NVMe for VM disks.
- Network: UniFi with a 10 GbE core and bonded links on the storage nodes, six VLANs with intrusion prevention on each, and two ad-blocking DNS resolvers that point every lab service at one reverse proxy with a wildcard certificate (Fig. 2).
- Edge: remote access only through a VPN, public services only through an outbound tunnel. No inbound ports.
- Power: a 6 kVA double-conversion UPS with about two and a half hours of runtime at the lab’s load, and a metered PDU, both read over SNMP.
Hardware stack
Nodes
| Ref | Role | Hardware | CPU · RAM | Network |
|---|---|---|---|---|
| N1 | Storage: NVMe pool, VM template, file shares | Supermicro SYS-5019A-FN5T | Atom C3958, 16 cores · 64 GB | 4 × 10 GbE, LACP |
| N2 | Storage: SAS disk shelves | Supermicro SYS-5019A-FN5T, LSI 9400-16e HBA | Atom C3958, 16 cores · 64 GB | 4 × 10 GbE, LACP |
| N3 | Applications and dashboards | Supermicro Xeon D | Xeon D-1587, 32 threads · 128 GB | 10 GbE |
| N4 | Media and AI inference | HP Pro SFF 400 G9, Intel Arc A310 | Core i5-14500, 20 threads · 32 GB | 10 GbE |
| N5 | Applications, DNS, proxy, agent VM | Supermicro Xeon D | Xeon D-1541, 16 threads · 64 GB | 10 GbE |
Storage, network and power
| Ref | Role | Hardware |
|---|---|---|
| J1–J2 | Disk shelves | 2 × Dell MD1400, dual-path SAS |
| Disks | 12 × 24 TB SAS HDD, 4 × 3.84 TB SAS SSD, 2 × 4 TB NVMe | |
| U1 | Gateway | UniFi Dream Machine SE |
| SW1–SW6 | Switching | USW EnterpriseXG 24, Pro Aggregation, Pro XG 48 PoE, 2 × Pro Max 16, Flex Mini |
| AP1–AP7 | WiFi | U6 Pro, U6 LR, U6 Mesh and U7 Pro XG access points |
| Power | Eaton 9PX 6000 online UPS, Server Technology Sentry metered PDU |
In total: 100 CPU threads, 352 GB of RAM and about 225 TB of usable storage across three ZFS pools.
Valhalla: one screen for the whole lab
Proxmox, UniFi, the UPS, the PDU and each application all have their own web UIs, and none of them answers the only question that matters at a glance: is everything healthy? Valhalla is the dashboard I built with Claude to answer it (Fig. 1). One page shows:
- every cluster node’s CPU, RAM and uptime, from the Proxmox API;
- UPS battery, runtime and load, and the PDU’s input power and current on all 30 outlets, over SNMP;
- UniFi client count and the state of every switch and access point;
- the media library and download queues, photos, documents and home-automation state;
- a health check with latency for 24 services, grouped by what they do.
The backend is a small Node/Express service with one route per source. It holds every API key and SNMP community, so the browser never sees a credential, and it polls the sources in parallel so one slow system can’t stall the page. Each card refreshes on its own and shows when its data was last fetched, so stale data is obvious. Uptime Kuma handles alerting and Grafana with Prometheus keeps 90 days of history; Valhalla is for the live view.
Hard-won rules
- Regenerate the MAC address on every cloned VM; the template’s MAC causes silent layer-2 conflicts.
- Build ZFS pools from stable drive IDs, because dual-path SAS shows every drive twice.
- Docker’s published ports bypass the host firewall, so they’re filtered in Docker’s own chain by a script that runs at boot.
- DNS upstreams stay plain UDP. Encrypted upstreams turned a 7 ms cache miss into about a second.
- The secondary DNS server doesn’t sync itself, so every rewrite change is copied to it deliberately.
- Changing a cluster node’s IP only works in a strict order: cluster config, hosts, DNS, certificates, rejoin.
Operated with an agent
The infrastructure is documented in one runbook in its own git repository, on a VM dedicated to Claude Code. The agent has a standing rule: after any real infrastructure change, update the runbook, commit and push. Non-secret facts are mirrored into my notes vault, so any future session, mine or an agent’s, starts from the current truth. A nightly job also pulls every host’s configuration into dated off-site backups.
A second agent runs unattended: the homelab agent watches the media pipeline every 15 minutes and repairs what breaks, inside a command gate and a quarantine. Saga, the request portal, can hand it a problem directly.